
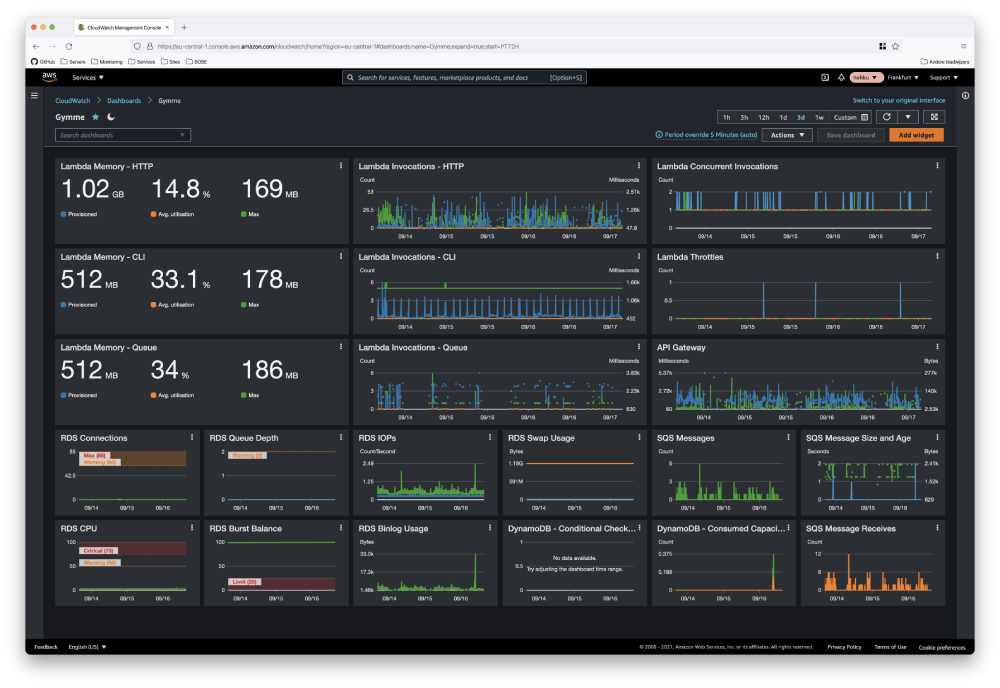
Laravel Vapor cloud dashboard using only Cloudwatch
George Boot • tech
In a recent blogpost, Michael Dyrynda showed a dashboard he has build for monitoring thenping.me. As Laravel Vapor only includes a very basic dashboard, he created a custom one. He used Grafana Cloud to build the dashboard.
When I read the article, I wondered why he used Grafana as AWS itself also offers a similar service. In fact, the data that is used on the dashboard, comes from AWS Cloudwatch, and Cloudwatch itself has very powerful dashboard functionalities built in. Unlike Grafana, it can't (easily at least) read data from a wide range of external sources, but since that is not really the case for this project, I don't think it matters.
Because I believe this dash could just as well be build using native Cloudwatch, I challenged myself to do so. When I shared this idea in the Serverless Laravel Slack, people seemed very interested and asked me if I was willing to share the dashboard. I am willing to do just that.
Lambda Insights
By default, Lambda does not export memory statistics to Cloudwatch. The only way to get information about memory and cold starts, is by parsing the raw logs. This can be done using Cloudwatch Logs Insights, but these values can't be nicely shown on your dashboard.
A while ago, AWS announced Lambda Insights. This is basically an opt-in extension to your functions, that will export statistics like actual memory usage, network throughput and cpu cycles to Cloudwatch.
Enabling this extension can simply be done by adding a layer in your vapor.yml. Look up the layer for your region on this page.
Example vapor.yml:
1id: 1234562name: my-awesome-app3 4environments:5 production:6 runtime: al27 layers:8 - vapor:php-8.0:al29 - arn:aws:lambda:eu-west-1:580247275435:layer:LambdaInsightsExtension:14Unfortunately, I haven't found a way to enable Lambda Insights for docker-based deployments. No worries, the rest of the dash will still work.
Copy, Search, Replace, Paste, Enjoy
All developers want in the end, is a simple copy/paste solution. I am pleased to inform you that you are about to get that! In Cloudwatch, it is possible to export and import complete dashboards as json. Practically this means, that once you copy the below json, you will have to search and replace the following values:
- Replace
PROJECT_NAMEwith the name of your Vapor project, eg.awesome-site - Replace
PROJECT_ENVwith the environment of your deployment, eg.production. If you are using Docker deployments, add-dto the end of your env (production-d,staging-d, etc.) - Replace
PROJECT_REGIONwith the AWS region your project lives in, eg.eu-west-1 - Replace
DATABASE_NAMEwith the name of your database as configured in Vapor, eg.my-app-db - Replace
API_GATEWAY_IDwith the ID of your projects API gateway. You can find this using the AWS Console. Example:yuttpf0t41
Note that the dashboard is made for API Gateway users. If you use a Application Elastic Load Balancer, an example is provided below the main json.
Once you have prepared the json in your editor of choice, head to the AWS Console to import the dashboard.
- After logging in, go to Cloudwatch, and in the menu of the left, select Dashboards
- Click Create dashboard, enter a name and once created, dismiss the popup to add your first graph as you won't need it
- In the top bar, select Actions and click View/edit source.
- Paste your prepared json, and hit Update
- Hit Save Dashboard
- Congrats, you now have an awesome dashboard!
Pro tip: view dashboard without loggin in
If you don't want to log in every time you want to check the dashboard (or want to permanently show it on a wall-mounted tv etc.), you can share your dashboard using a public url. Everyone with that url, will be able to view the dashboard and underlying metrics.
You can obtain such a public url, by clicking Actions in the top menu, and selecting Share dashboard. Pick Share your dashboard publicly, read the warning message and confirm.
Wanna express your gratitude with a donation? Become a (one-time) sponsor on GitHub Sponsor.
Have any questions? At the bottom of the page, you can comment on this post.
The dashboard json:
1{ 2 "widgets": [ 3 { 4 "height": 4, 5 "width": 8, 6 "y": 0, 7 "x": 8, 8 "type": "metric", 9 "properties": { 10 "metrics": [ 11 [ "AWS/Lambda", "Invocations", "FunctionName", "vapor-PROJECT_NAME-PROJECT_ENV", { "color": "#2ca02c" } ], 12 [ ".", "Errors", ".", ".", { "color": "#ff7f0e" } ], 13 [ ".", "Duration", ".", ".", { "yAxis": "right", "color": "#1f77b4", "stat": "Average" } ] 14 ], 15 "view": "timeSeries", 16 "stacked": false, 17 "region": "PROJECT_REGION", 18 "stat": "Sum", 19 "period": 300, 20 "title": "Lambda Invocations - HTTP", 21 "yAxis": { 22 "right": { 23 "showUnits": true 24 }, 25 "left": { 26 "showUnits": true 27 } 28 }, 29 "liveData": false, 30 "legend": { 31 "position": "hidden" 32 } 33 } 34 }, 35 { 36 "height": 4, 37 "width": 4, 38 "y": 12, 39 "x": 0, 40 "type": "metric", 41 "properties": { 42 "metrics": [ 43 [ "AWS/RDS", "DatabaseConnections", "DBInstanceIdentifier", "DATABASE_NAME", { "color": "#2ca02c" } ] 44 ], 45 "view": "timeSeries", 46 "stacked": false, 47 "region": "PROJECT_REGION", 48 "stat": "Average", 49 "period": 300, 50 "annotations": { 51 "horizontal": [ 52 { 53 "color": "#ff7f0e", 54 "label": "Warning", 55 "value": 60, 56 "fill": "above" 57 }, 58 { 59 "color": "#d62728", 60 "label": "Max", 61 "value": 85, 62 "fill": "above" 63 } 64 ] 65 }, 66 "yAxis": { 67 "left": { 68 "min": 0, 69 "showUnits": false 70 } 71 }, 72 "title": "RDS Connections", 73 "legend": { 74 "position": "hidden" 75 } 76 } 77 }, 78 { 79 "height": 4, 80 "width": 4, 81 "y": 12, 82 "x": 4, 83 "type": "metric", 84 "properties": { 85 "metrics": [ 86 [ "AWS/RDS", "DiskQueueDepth", "DBInstanceIdentifier", "DATABASE_NAME" ] 87 ], 88 "view": "timeSeries", 89 "stacked": false, 90 "region": "PROJECT_REGION", 91 "stat": "Average", 92 "period": 300, 93 "yAxis": { 94 "left": { 95 "showUnits": false, 96 "min": 0 97 } 98 }, 99 "title": "RDS Queue Depth",100 "legend": {101 "position": "hidden"102 },103 "annotations": {104 "horizontal": [105 {106 "color": "#ff7f0e",107 "label": "Warning",108 "value": 2,109 "fill": "above"110 }111 ]112 }113 }114 },115 {116 "height": 4,117 "width": 4,118 "y": 12,119 "x": 8,120 "type": "metric",121 "properties": {122 "metrics": [123 [ "AWS/RDS", "WriteIOPS", "DBInstanceIdentifier", "DATABASE_NAME", { "color": "#2ca02c" } ],124 [ ".", "ReadIOPS", ".", ".", { "color": "#1f77b4" } ]125 ],126 "view": "timeSeries",127 "stacked": false,128 "region": "PROJECT_REGION",129 "stat": "Average",130 "period": 300,131 "title": "RDS IOPs",132 "legend": {133 "position": "hidden"134 },135 "yAxis": {136 "left": {137 "min": 0138 }139 }140 }141 },142 {143 "height": 4,144 "width": 8,145 "y": 0,146 "x": 16,147 "type": "metric",148 "properties": {149 "metrics": [150 [ "AWS/Lambda", "ConcurrentExecutions", "FunctionName", "vapor-PROJECT_NAME-PROJECT_ENV" ],151 [ "...", "vapor-PROJECT_NAME-PROJECT_ENV-cli" ],152 [ "...", "vapor-PROJECT_NAME-PROJECT_ENV-queue" ]153 ],154 "view": "timeSeries",155 "stacked": false,156 "region": "PROJECT_REGION",157 "stat": "Maximum",158 "period": 300,159 "title": "Lambda Concurrent Invocations",160 "yAxis": {161 "right": {162 "showUnits": true163 },164 "left": {165 "min": 0166 }167 },168 "liveData": false,169 "legend": {170 "position": "hidden"171 }172 }173 },174 {175 "height": 4,176 "width": 8,177 "y": 4,178 "x": 16,179 "type": "metric",180 "properties": {181 "metrics": [182 [ "AWS/Lambda", "Throttles", "FunctionName", "vapor-PROJECT_NAME-PROJECT_ENV" ],183 [ "...", "vapor-PROJECT_NAME-PROJECT_ENV-cli" ],184 [ "...", "vapor-PROJECT_NAME-PROJECT_ENV-queue" ]185 ],186 "view": "timeSeries",187 "stacked": false,188 "region": "PROJECT_REGION",189 "stat": "Maximum",190 "period": 300,191 "title": "Lambda Throttles",192 "yAxis": {193 "right": {194 "showUnits": true195 }196 },197 "liveData": false,198 "legend": {199 "position": "hidden"200 }201 }202 },203 {204 "height": 4,205 "width": 8,206 "y": 4,207 "x": 8,208 "type": "metric",209 "properties": {210 "metrics": [211 [ "AWS/Lambda", "Invocations", "FunctionName", "vapor-PROJECT_NAME-PROJECT_ENV-cli", { "color": "#2ca02c" } ],212 [ ".", "Errors", ".", ".", { "color": "#ff7f0e" } ],213 [ ".", "Duration", ".", ".", { "yAxis": "right", "color": "#1f77b4", "stat": "Average" } ]214 ],215 "view": "timeSeries",216 "stacked": false,217 "region": "PROJECT_REGION",218 "stat": "Sum",219 "period": 300,220 "title": "Lambda Invocations - CLI",221 "yAxis": {222 "right": {223 "showUnits": true224 },225 "left": {226 "showUnits": true227 }228 },229 "liveData": false,230 "legend": {231 "position": "hidden"232 }233 }234 },235 {236 "height": 4,237 "width": 8,238 "y": 8,239 "x": 8,240 "type": "metric",241 "properties": {242 "metrics": [243 [ "AWS/Lambda", "Invocations", "FunctionName", "vapor-PROJECT_NAME-PROJECT_ENV-queue", { "color": "#2ca02c" } ],244 [ ".", "Errors", ".", ".", { "color": "#ff7f0e" } ],245 [ ".", "Duration", ".", ".", { "yAxis": "right", "color": "#1f77b4", "stat": "Average" } ]246 ],247 "view": "timeSeries",248 "stacked": false,249 "region": "PROJECT_REGION",250 "stat": "Sum",251 "period": 300,252 "title": "Lambda Invocations - Queue",253 "yAxis": {254 "right": {255 "showUnits": true256 },257 "left": {258 "showUnits": true259 }260 },261 "liveData": false,262 "legend": {263 "position": "hidden"264 }265 }266 },267 {268 "height": 4,269 "width": 8,270 "y": 0,271 "x": 0,272 "type": "metric",273 "properties": {274 "metrics": [275 [ "LambdaInsights", "total_memory", "function_name", "vapor-PROJECT_NAME-PROJECT_ENV", { "label": "Provisioned", "id": "m1" } ],276 [ ".", "memory_utilization", ".", ".", { "label": "Avg. utilisation", "id": "m2" } ],277 [ ".", "used_memory_max", ".", ".", { "label": "Max", "id": "m3", "stat": "Maximum" } ],278 [ "AWS/Lambda", "Duration", "FunctionName", ".", { "label": "Avg. duration", "visible": false } ]279 ],280 "view": "singleValue",281 "title": "Lambda Memory - HTTP",282 "region": "PROJECT_REGION",283 "stat": "Average",284 "period": 300,285 "setPeriodToTimeRange": true286 }287 },288 {289 "height": 4,290 "width": 8,291 "y": 4,292 "x": 0,293 "type": "metric",294 "properties": {295 "metrics": [296 [ "LambdaInsights", "total_memory", "function_name", "vapor-PROJECT_NAME-PROJECT_ENV-cli", { "label": "Provisioned", "id": "m1" } ],297 [ ".", "memory_utilization", ".", ".", { "label": "Avg. utilisation", "id": "m2" } ],298 [ ".", "used_memory_max", ".", ".", { "label": "Max", "id": "m3", "stat": "Maximum" } ],299 [ "AWS/Lambda", "Duration", "FunctionName", ".", { "label": "Avg. duration", "visible": false } ]300 ],301 "view": "singleValue",302 "title": "Lambda Memory - CLI",303 "region": "PROJECT_REGION",304 "stat": "Average",305 "period": 300,306 "setPeriodToTimeRange": true307 }308 },309 {310 "height": 4,311 "width": 8,312 "y": 8,313 "x": 0,314 "type": "metric",315 "properties": {316 "metrics": [317 [ "LambdaInsights", "total_memory", "function_name", "vapor-PROJECT_NAME-PROJECT_ENV-queue", { "label": "Provisioned", "id": "m1" } ],318 [ ".", "memory_utilization", ".", ".", { "label": "Avg. utilisation", "id": "m2" } ],319 [ ".", "used_memory_max", ".", ".", { "label": "Max", "id": "m3", "stat": "Maximum" } ]320 ],321 "view": "singleValue",322 "title": "Lambda Memory - Queue",323 "region": "PROJECT_REGION",324 "stat": "Average",325 "period": 300,326 "setPeriodToTimeRange": true327 }328 },329 {330 "height": 4,331 "width": 8,332 "y": 8,333 "x": 16,334 "type": "metric",335 "properties": {336 "metrics": [337 [ "AWS/ApiGateway", "IntegrationLatency", "Stage", "PROJECT_ENV", "ApiId", "API_GATEWAY_ID", { "color": "#2ca02c" } ],338 [ ".", "DataProcessed", ".", ".", ".", ".", { "yAxis": "right", "color": "#1f77b4" } ]339 ],340 "view": "timeSeries",341 "stacked": false,342 "region": "PROJECT_REGION",343 "stat": "Average",344 "period": 300,345 "title": "API Gateway",346 "yAxis": {347 "right": {348 "showUnits": true349 }350 },351 "liveData": false,352 "legend": {353 "position": "hidden"354 }355 }356 },357 {358 "height": 4,359 "width": 4,360 "y": 16,361 "x": 8,362 "type": "metric",363 "properties": {364 "metrics": [365 [ "AWS/RDS", "BinLogDiskUsage", "DBInstanceIdentifier", "DATABASE_NAME", { "color": "#2ca02c", "id": "m1" } ]366 ],367 "view": "timeSeries",368 "stacked": false,369 "region": "PROJECT_REGION",370 "stat": "Average",371 "period": 300,372 "title": "RDS Binlog Usage",373 "legend": {374 "position": "hidden"375 }376 }377 },378 {379 "height": 4,380 "width": 4,381 "y": 12,382 "x": 12,383 "type": "metric",384 "properties": {385 "metrics": [386 [ "AWS/RDS", "SwapUsage", "DBInstanceIdentifier", "DATABASE_NAME" ],387 [ ".", "FreeableMemory", ".", "." ]388 ],389 "view": "timeSeries",390 "stacked": false,391 "region": "PROJECT_REGION",392 "stat": "Average",393 "period": 300,394 "title": "RDS Swap Usage",395 "legend": {396 "position": "hidden"397 },398 "yAxis": {399 "left": {400 "min": 0401 }402 }403 }404 },405 {406 "height": 4,407 "width": 4,408 "y": 12,409 "x": 16,410 "type": "metric",411 "properties": {412 "metrics": [413 [ "AWS/SQS", "NumberOfMessagesReceived", "QueueName", "PROJECT_NAME-PROJECT_ENV", { "color": "#2ca02c" } ]414 ],415 "view": "timeSeries",416 "stacked": false,417 "region": "PROJECT_REGION",418 "stat": "Sum",419 "period": 300,420 "title": "SQS Messages",421 "legend": {422 "position": "hidden"423 }424 }425 },426 {427 "height": 4,428 "width": 4,429 "y": 12,430 "x": 20,431 "type": "metric",432 "properties": {433 "metrics": [434 [ "AWS/SQS", "ApproximateAgeOfOldestMessage", "QueueName", "PROJECT_NAME-PROJECT_ENV", { "stat": "Maximum" } ],435 [ ".", "SentMessageSize", ".", ".", { "color": "#2ca02c", "yAxis": "right" } ]436 ],437 "view": "timeSeries",438 "stacked": false,439 "region": "PROJECT_REGION",440 "stat": "Average",441 "period": 300,442 "title": "SQS Message Size and Age",443 "legend": {444 "position": "hidden"445 }446 }447 },448 {449 "height": 4,450 "width": 4,451 "y": 16,452 "x": 20,453 "type": "metric",454 "properties": {455 "metrics": [456 [ "AWS/SQS", "NumberOfMessagesReceived", "QueueName", "PROJECT_NAME-PROJECT_ENV", { "color": "#2ca02c" } ],457 [ ".", "NumberOfMessagesDeleted", ".", "." ]458 ],459 "view": "timeSeries",460 "stacked": false,461 "region": "PROJECT_REGION",462 "stat": "Sum",463 "period": 300,464 "title": "SQS Message Receives",465 "legend": {466 "position": "hidden"467 }468 }469 },470 {471 "height": 4,472 "width": 4,473 "y": 16,474 "x": 16,475 "type": "metric",476 "properties": {477 "metrics": [478 [ "AWS/DynamoDB", "ConsumedWriteCapacityUnits", "TableName", "vapor_cache", { "color": "#2ca02c" } ],479 [ ".", "ConsumedReadCapacityUnits", ".", "." ]480 ],481 "view": "timeSeries",482 "stacked": false,483 "region": "PROJECT_REGION",484 "stat": "Average",485 "period": 300,486 "title": "DynamoDB - Consumed Capacity Units",487 "legend": {488 "position": "hidden"489 },490 "yAxis": {491 "left": {492 "min": 0493 }494 }495 }496 },497 {498 "height": 4,499 "width": 4,500 "y": 16,501 "x": 12,502 "type": "metric",503 "properties": {504 "metrics": [505 [ "AWS/DynamoDB", "ConditionalCheckFailedRequests", "TableName", "vapor_cache", { "color": "#2ca02c" } ]506 ],507 "view": "timeSeries",508 "stacked": false,509 "region": "PROJECT_REGION",510 "stat": "Sum",511 "period": 300,512 "title": "DynamoDB - Conditional Check Failures",513 "legend": {514 "position": "hidden"515 }516 }517 },518 {519 "height": 4,520 "width": 4,521 "y": 16,522 "x": 4,523 "type": "metric",524 "properties": {525 "metrics": [526 [ "AWS/RDS", "BurstBalance", "DBInstanceIdentifier", "DATABASE_NAME", { "color": "#2ca02c" } ]527 ],528 "view": "timeSeries",529 "stacked": false,530 "region": "PROJECT_REGION",531 "stat": "Average",532 "period": 300,533 "annotations": {534 "horizontal": [535 {536 "label": "Limit",537 "value": 25,538 "fill": "below"539 }540 ]541 },542 "yAxis": {543 "left": {544 "min": 0,545 "max": 100,546 "showUnits": false547 }548 },549 "title": "RDS Burst Balance",550 "legend": {551 "position": "hidden"552 }553 }554 },555 {556 "height": 4,557 "width": 4,558 "y": 16,559 "x": 0,560 "type": "metric",561 "properties": {562 "metrics": [563 [ "AWS/RDS", "CPUUtilization", "DBInstanceIdentifier", "DATABASE_NAME", { "id": "m2", "color": "#2ca02c" } ]564 ],565 "view": "timeSeries",566 "stacked": false,567 "region": "PROJECT_REGION",568 "stat": "Average",569 "period": 300,570 "annotations": {571 "horizontal": [572 {573 "label": "Crirical",574 "value": 75,575 "fill": "above"576 },577 {578 "label": "Warning",579 "value": 50580 }581 ]582 },583 "yAxis": {584 "left": {585 "min": 0,586 "max": 100,587 "showUnits": false588 }589 },590 "title": "RDS CPU",591 "legend": {592 "position": "hidden"593 }594 }595 }596 ]597}Application Elastic Load Balancer example snippet:
1{ 2 "view": "timeSeries", 3 "stacked": false, 4 "metrics": [ 5 [ "AWS/ApplicationELB", "ProcessedBytes", "LoadBalancer", "app/AELB_NAME" ], 6 [ ".", "LambdaTargetProcessedBytes", ".", "." ] 7 ], 8 "region": "PROJECT_REGION", 9 "title": "Application ELB",10 "period": 300,11 "legend": {12 "position": "hidden"13 }14}Make sure to replace AELB_NAME with the instance name of your AELB.